Friday’s Child (Slight Return)

Three things:

• A hearty congratulations to Pete Abraham, who is leaving The Journal News for The Boston Globe and in doing so will move from covering the Yankees to the hated Red Sox. As any Yankee fan with an Internet connection knows, Pete’s been THE go-to beat reporter for all things Yankees for the past few years, punching well above his weight against the city’s major dailies because he took to the medium of blogging much more readily than his competitors.

In retrospect, that’s hardly a surprise. Pete’s been at the Journal News for the past decade, and back in 2004, he interviewed me for an article he wrote about the baseball blogosphere and threw a high compliment my way: “[Alex] Belth and many other bloggers were first inspired by Aaron Gleeman, Jay Jaffe and David Pinto, the Willie, Mickey and the Duke of this fledgling genre. They were among the first and are now three of the best-read bloggers.”

Such flattery.

It wasn’t until 2006 that Pete added blogging to his beat chores, but in doing so he’s set an example of which the rest of the industry is only beginning to catch up (likely while muttering under their breaths). “Blog” was just another four-letter word in the world of mainstream sports reporting, and while there are still hundreds if not thousands of his peers who still don’t get it, he took to it like a duck to water. Not only did he manage to create a durable, enthusiastic community at the LoHud Yankees Blog, as it’s officially known, but he intuitively understood that things like pregame lineup postings, audio snippets and in-game notes were what his audience craved, and usually scooped the competition with his tidbits of info about injuries and roster moves (sadly, he was never any good at telling me when the Yankees game would be rained out, but that’s a small quibble borne of the fact that the press guys are just as in the dark about said topic).

It was only a matter of time before he moved up in the world, and I had high hopes he’d remain in the New York market. As happy as I am for the big lug, he move to Boston is a bit of a kick in the stomach for his Yank-flavored audience, but you can’t begrudge the man his due. He’s earned this one, and I wish him nothing but the best.

• Twenty-seven years after it was published, I’m finally the owner of a copy of the 1982 Bill James Baseball Abstract. Though my curiosity had been piqued as a 10-year old when I read Dan Okrent’s 1981 Sports Illustrated article, I’d never actually owned my own copy. I borrowed the ’82 from a friend that fateful summer and kept it for a couple months, but if memory serves, I returned it once a minor feud over baseball cards was settled. I’ve been hunting for my own copy for the better part of the past decade and on at least two other occasions had thought I’d secured a copy, one through a bookseller who regretfully wrote back to say he no longer had it in stock, the other by an unscrupulous eBay retailer who refused to ship internationally despite making no note of that on the sale page.

Published by Ballantine, the ’82 was the first of the mass-market James books, and because of that, it was a landmark, for it introduced such key concepts as the Pythagorean Method, the Defensive Spectrum, Defensive Efficiency, Runs Created, Isolated Power, park effects, the age 27 prime, pitcher run support, and so much more to the great unwashed audience. All of those concepts are still in use today, and they remain fundamental to the field of sabermetrics.

• This week’s Hit List is here, with the Yankees on top, the Dodgers second, and the Red Sox third:

[#1 Yankees] Big Man: As the Yankees close in on 100 wins, lost amid A.J. Burnett’s meltdowns, Andy Pettitte’s fatigued shoulder and the never-ending drama that is the Joba Rules is the performance of CC Sabathia. He leads the league in wins (17), is second in innings (213 1/3) and ranks among the top 10 in SNLVAR, ERA and strikeouts. The Yankees have won 11 of his last 12 starts, a span over which he’s put up a 2.75 ERA.

[#2 Dodgers] Coming Back: After seeing their division lead dwindle to two games while their rotation takes turns foregoing Clayton Kershaw, Randy Wolf, and now Chad Billingsley, the Dodgers fall back on strong performances by Hiroki Kuroda, Vicente Padilla and Jon Garland to beat up on the Giants and Pirates and restore their NL West lead. Andre Ethier homers on back-to-back nights against the Bucs, the latter a 13th-inning game-winner which marks his sixth walkoff hit of the year. In doing so, he becomes the first Dodger to reach the 30-homer plateau since Adrian Beltre in 2004.

[#3 Red Sox] Dice Is Nice: Daisuke Matsuzaka throws six shutout innings against the Angels in his first big-league appearance in nearly three months. Though his ERA still stands at 7.05, Matsuzaka’s return is well-timed given the potential diceyness of the team’s current rotation situation. Elsewhere amid a seven-game winning streak, Jon Lester tosses eight shutout innings against the Rays two days after a rocky 23-pitch stint is washed away by the rain. He’s riding a 17-inning scoreless streak and has allowed just 11 runs over his last eight starts, and now ranks third in the league in strikeouts (211), fifth in SNLVAR (5.9) and sixth in ERA (3.29).

Tough to believe I’ve got only two more of these to do this season. Where does the time go?

One for the Ages

“When the legend becomes fact, print the legend.”
— Maxwell Scott, The Man Who Shot Liberty Valance

That Satchel Paige was one of the greatest baseball players of all time isn’t exactly a controversial topic these days. Even casual fans are probably familiar with the colorful Paige’s aphorisms (“Don’t look back. Something might be gaining on you”), and have some understanding not only of how brightly he shone amid the high-caliber talent which was so cruelly deprived of the opportunity to play major league baseball by the game’s segregation, but also the fact that even a forty-something-year-old version of the pitcher found success at the major league level once Jackie Robinson shattered the color barrier. It’s certainly a tale worth telling and retelling, though as engaging as the oft-repeated lore surrounding the pitcher’s career and character is, repetition has tended to distort and oversimplify the truth about him.

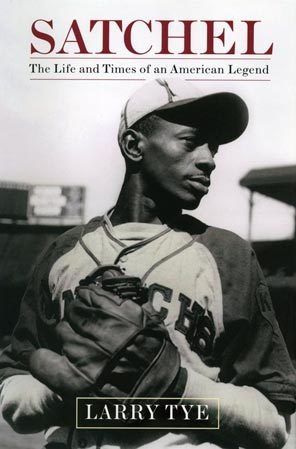
Luckily, Larry Tye has come along to boldly confront the myths surrounding Paige in an excellent new biography, Satchel: The Life and Times of an American Legend. I received a copy in the mail several weeks ago and had been itching to dive into its pages before finally getting an opportunity during my recent trip to Buenos Aires.

Many of those myths surrounding Paige, of course, were of the pitcher’s own making via interviews and as-told-to autobiographies, and they were a crucial part of his public relations strategy. In his preface to the book (published as an excerpt at Bronx Banter), Tye explains Paige’s obfuscation about his birthdate:

Satchel knew that, despite being the fastest, winningest pitcher alive, being black meant he never would get the attention he deserved. That was easy to see in the backwaters of the Negro Leagues but it remained true when he hit the Majors at age forty-two, with accusations flying that his signing was a mere stunt. He needed an edge, a bit of mystery, to romance sportswriters and fans. Longevity offered the perfect platform. “They want me to be old,” Satchel said, “so I give ‘em what they want. Seems they get a bigger kick out of an old man throwing strikeouts.” He feigned exasperation when reporters pressed to know the secret of his birth, insisting, “I want to be the onliest man in the United States that nobody knows nothin’ about.” In fact he wanted just the opposite: Satchel masterfully exploited his lost birthday to ensure the world would remember his long life.

It was not a random image Satchel crafted for himself but one he knew played perfectly into perceptions whites had back then of blacks. It was a persona of agelessness and fecklessness, one where a family’s entire history could be written into a faded bible and a goat could devour both. The black man in the era of Jim Crow was not expected to have human proportions at all, certainly none worth documenting in public records or engraving for posterity. He was a phantom, without the dignity of a real name (hence the nickname Satchel), a rational mother (Satchel’s mother was so confused she supposedly mixed him up with his brother), or an age certain (“Nobody knows how complicated I am,” he once said. “All they want to know is how old I am.”). That is precisely the image that nervous white owners relished when they signed the first black ballplayers. Few inquired where the pioneers came from or wanted to hear about their struggles. In these athletes’ very anonymity lay their value.

Playing to social stereotypes the way he did with his age is just half the story of Satchel Paige, although it is the half most told. While many dismissed him as a Stepin Fetchit if not an Uncle Tom, this book makes clear that he was something else entirely – a quiet subversive, defying Uncle Tom and Jim Crow. Told all his life that black lives matter less than white ones, he teased journalists by adding or subtracting years each time they asked his age, then asking them, “How old would you be if you didn’t know how old you were?” Relegated by statute and custom to the shadows of the Negro Leagues, he fed Uncle Sam shadowy information on his provenance. Yet growing up in the Deep South he knew better than to flaunt the rules openly, so he did it opaquely. He made his relationships with the press and the public into a game, using insubordination and indirection to challenge his segregated surroundings.

While Tye digs deep — the book’s bibliography and end notes are both at least 35 pages long, and he interviewed more than 200 Negro League and major league opponents and teammates — and lays waste to some of the tall tales surrounding Paige, what emerges is an altogether more nuanced and ultimately more compelling version of the ageless pitcher. Some of Paige’s embellishments, such as his account of his pitching the championship finale for Dragones de Ciudad Trujillo in the Dominican Republic in 1937, don’t stand up to the light of day. Others, such as the masterful control which allowed him to throw the ball over a chewing gum wrapper with amazing consistency or his brazen penchant for calling in his outfielders and then getting the crucial strikeout(s), he finds well-documented.

As always, there are the quotes, most of which really did come out of Paige’s mouth in some form or other. Asked by his manager if he threw fast consistently, he replied, “No sir, i do it all the time.” Asked about his philosophy of pitching, he warned, “Bases on balls is the curse of a nation… throw strikes at all times. Unless you don’t want to.” Of course, it’s interesting to learn that the six rules for staying young for which he’s credited were partly the work of Collier‘s Richard Donovan, as the sidebar to a three-part profile from 1953. And, as Tye notes, not always taken to heart by the font of wisdom from which they supposedly flowed.

Through it all, Tye meticulously tracks Paige’s peripatetic ways, noting not only his myriad stops both on his way up (he began pitching professionally in Chattanooga in 1926) and down (his last major league appearance was with the Kansas City A’s in 1965; his last regular duty was with the Triple-A Miami Marlins from 1956-1958) but also his numerous barnstorming tours, not to mention the countless times he jumped teams to collect a bigger payday, often by less-than-honorably walking out on his contract. The book’s appendix even has a well-compiled statistical thumbnail, collecting the best-researched data on Paige’s time in the Negro Leagues, majors, minors, East-West All-Star Games, North Dakota, California Winter League and Latin leagues (though it misses two late stints in the minors in Portland and Hampton, Virginia).

The author offers a good deal of insight into the conditions Paige played under and the men he played for, such as Pittsburgh Crawfords owner Gus Greenlee and Kansas City Monarchs co-owner J.L. Wilkinson (whose business partner, Tom Baird, was a member of the Ku Klux Klan). If I have a quibble about the book it’s that he doesn’t go into great enough detail about many of the men he played with and against, particularly Josh Gibson, though the portraits of barnstorming rivals Dizzy Dean and Bob Feller do stand out. He’s acutely aware of the generation gap between Paige and Robinson, or Paige and Indians teammate Larry Doby, who broke the American League color line in July 1947, and doesn’t sugarcoat Paige’s mixed emotions at being passed over as the man to break the majors’ color barrier.

In all, Tye’s created an impressive work that never feels bogged down by its lofty ambitions or the weight of the author’s research; his prose is a breeze, for the most part. He makes a convincing case for Paige not only as one of baseball’s all-time greats but as an agent of social change, covering seemingly millions of miles as he lay the groundwork for the game’s integration, delighting fans and winning over doubters and even the occasional bigot while building a legacy that might be matched only by Babe Ruth’s in its importance to the game and the nation. This one’s a keeper.

For more about the book, see Tye’s web site.

Bummer in Boston

I missed this bit of news while I was gone got wind of it this morning, just hours before getting a note from host Chris Villani. Sadly, the ESPN station which carried my Boston radio hits has gone off the air, with the staff laid off. Villani has already landed some other work at WWZN 1510 as well as WEEI, but “The Young Guns” are no more, taking the Baseball Prospectus slot that I’d held for the past year with it.

I’m sorry to see our weekly spot go. It was a ton of fun while it lasted both at WWZN and ESPN, and I’d like to extend a hearty thanks to Villani and the rest of his crew for putting together a smart show that consistently rose above the general inanity of sports talk radio, and wish them the best of luck in the future — hopefully one which finds us working together again.

Halo Effect?

I spend a lot of my time at Baseball Prospectus exploring the margin between teams’ expected performance as based upon variants of Bill James’ Pythagorean formula and their actual performance, looking for reasons why it happens and cues as to what it portends. In Tuesday’s edition of Hit and Run, I explore the Angels’ penchant for beating expectations:

According to our Adjusted Standings page, through Sunday the Angels were 11.5 games above their third-order Pythagenpat projection, a fancy way of saying that they’ve won over 11 games more than the combination of events on the field — their hits, walks, total bases, stolen bases, and outs of all kinds, as well as those of their opponents, all adjusted for park, league, quality of competition and temperature of porridge — would suggest. That’s by far the top mark in the majors this year, and while it’s not enough to break the single-season record of 16.0, set by last year’s Angels, it does crack the all-time top 10, and place them in select company:
Rnk  Year Team         W-L    Pct    R    RA   AEQR  AEQRA   D3
1 2008 Angels 100-62 .617 765 697 754 725 16.0
2 2004 Yankees 101-61 .623 897 808 911 831 12.7
3 1970 Reds 102-60 .630 775 681 757 676 12.6
4 2007 D'backs 90-72 .556 712 732 708 739 12.2
5T 1954 Dodgers 92-62 .597 778 740 782 749 12.1
5T 2005 White Sox 99-63 .611 741 645 740 684 12.1
7 1905 Tigers 79-74 .516 512 604 524 601 11.9
8T 1924 Dodgers 92-62 .597 717 679 717 684 11.7
8T 2002 Twins 94-67 .584 768 712 759 741 11.7
10 2009 Angels 86-56 .606 786 679 777 739 11.5

...

Projected across a 162-game schedule, the Angels’ current performance is the equivalent of outdoing their third-order projection by 13.1 games, which would rank second on this list. However, it’s a misnomer to say they’re actually “on pace” for such a finish, since teams that are outperforming their Pythagorean records by wide margins in either direction tend to regress to the mean. Case in point, they lost on Monday night to reduce their D3 (the difference between their third-order wins and actual wins) to 10.9.

Still, making the list is remarkable enough; from among a field of over 2,200 team-seasons dating back to 1901, just one percent of them have turned in a season at least 10 wins above expectation. What’s even more remarkable is that this marks the second year in a row that the Angels have exceeded expectations by at least 10 games, and the third year in a row they’ve done so by at least eight games, both of which are firsts. Only five teams have even managed the latter feat in back-to-back years

From there, the discussion turns to some of the generalities of overperforming one’s projected record:

We often talk of teams that over- or underperform their projected records as “lucky” or “unlucky,” but it’s a misnomer to chalk up the entirety of such discrepancies to luck. They generally stem from an irregular distribution of runs, so “randomness” may be a better term. Overachieving teams tend to win most of the close games but get blown out a few times. The 16 teams who exceeded their third-order projections by 10 wins or more while playing in the Retrosheet era (1954 onward) — call them the “Plus Tens” — went a combined 469-281 (.625) in one-run games and 324-170 (.656) in two-run games, but in games decided by six or more runs, they were just 223-259 (.462), a mark that includes the 1954 Indians’ 20-5 record in such blowouts. All told, those teams went 1016-710 (.586), right in line with their overall .589 winning percentage, while outscoring their opponents by 125 runs in such extreme games. That’s the equivalent of a 95-67 team outscoring their opponents by just 11 runs over the course of a season, about nine percent of the run differential such teams have historically posted.

…A major factor in outperforming one’s projected record is having relatively more success in higher-leverage situations, such as hitting well with runners in scoring position, or being especially stingy in late-game relief. As I noted last year, a strong bullpen is a consistent means of such overachievement; the correlation between a team’s cumulative WXRL and its D3 is .42, whereas it’s just .20 for SNLVAR. Of the 16 Retrosheet-era teams above, the 1977 Orioles were the only ones who failed to finish in their league’s top three in WXRL.

This year’s Angels are set to buck that trend given a bullpen that currently ranks sixth in WXRL, though that’s the product of a wretched first month, after which they’ve been the second best bullpen in the league by that measure. Of course, it also helps that the team is second in the league in scoring, and first in OPS with runners in scoring position. They’ve been clutch on both sides of the ball to the extent that you don’t often see. How well that holds up remains to be seen.

• • •

Due to travel — I was halfway around the globe in Buenos Aires and Montevideo last week — I never got a chance to post a link to the September 4 Hit List.

The Circuit Gap

In today’s Baseball Prospectus/ESPN Insider double cheeseburger special, I grapple with the American League’s persistent advantage over the National League in interleague play. The AL has gotten the upper hand in each of the past six years and has won at a .566 clip over the past five, or .560 over the past three.

To figure out what the strength of the two “teams” are that could produce a result where one won at a .560 clip, we turn to what Bill James called the Log5 method, one I’ve referenced in my articles on schedule strength and one that Clay Davenport uses — literally millions of times a day — to generate the daily Playoff Odds reports. The formula boils down to WPct = .500 + A – B, where WPct is the observed outcome percentage (.560) and A and B are the two teams. Since we also know that in this case, the winning percentages are complementary (A + B = 1.000), it’s simple algebra to determine that a .530 team playing a .470 team would produce that observed .560 winning percentage.

…One revealing aspect about the AL’s advantage over the NL is that even the lousier Junior Circuit teams are beating the Senior Circuit ones consistently. Sticking with the last five years of data (including this unfinished season) and splitting each league into upper and lower halves in terms of interleague records — the 35 best (or worst) team-seasons in each half in the AL, 40 in the NL — we find that AL’s better half, which won at a .561 clip in those intraleague games, boosted their winning percentage to .610 in interleague games. The lower half, which produced a measly .438 winning percentage in intraleague, kicked NL tail at a .523 clip. The NL’s better half posted a .551 winning percentage in intraleague play but just a .447 mark in interleague play, while the lower half dipped from .450 to .421.

This tendency persists if we break the teams into smaller groups. Here it is in quintiles:

Group   Intra   Inter
AL1 .594 .595
AL2 .550 .627
AL3 .504 .587
AL4 .458 .466
AL5 .392 .556

NL1 .580 .439
NL2 .538 .449
NL3 .503 .461
NL4 .460 .408
NL5 .418 .414

Granted, we’re not talking about huge sample sizes here (14 seasons apiece in the AL groups, 16 in the NL groups), but… wow. Every NL grouping, from the best 20 percent to the worst, won significantly less than 50 percent of its games against the AL. The top three AL groupings dominated interleague play, and while the fourth AL group won less than half its games, the bottom grouping won at a robust .556 clip, thanks to a couple recent Orioles teams going 11-7, a couple of Royals teams posted winning records (including 13-5 in 2008), and just two of the 14 teams in the group finishing below .500 in interleague play.

There’s no shortage of theories as to why the AL enjoys such an advantage, from the DH rule to the evolutionary pressure of keeping up with the AL East arms race to the decrepitude of the NL’s worst teams to the notion that the AL somehow enjoys a market size advantage, but that’s a topic for another day, and maybe another writer, as I’m mostly interested in the practical applications for this when it comes to strength of schedule and Hit List rankings.

Bag Job

One of the post-9/11 Yankee Stadium policies that made attending a game so annoying during the park’s twilight years was their ban on bags and backpacks:

Accompanying the regular renditions of “God Bless America” were heightened security procedures that subjected patrons to no small litany of hassles while doing little to make them more secure. Given the cursory frisking procedures and lack of metal detection capabilities, it would have been possible to gain entry with a 9mm handgun jammed down the back of one’s pants and a Bowie knife sheathed in one’s sock, but without those, the organization simply inflicted its increasing paranoia and greed upon paying customers. Backpacks and briefcases were immediately banned from the ballpark after September 11, as though any potential ticketholder might be a terrorist smuggling in a tactical nuclear weapon swiped from the imagination of some z-grade thriller. Not even Shea Stadium—located only two miles from LaGuardia Airport—stooped to such extremes. Anyone coming to the park while porting one of the banned bag types—say, from work—was forced to check it for a fee at one of the bars or restaurants across River Avenue. Anyone wishing to schlep a bagful of items into the stadium — say, a scorebook, a jacket, and reading material for the long subway ride home — was forced to place those items in a flimsy, clear plastic grocery-type bag available outside the turnstiles. No other types of bags, such as ones with reinforced handles, were allowed, first for vague “security purposes,” and then, once fans began pressing Yankee security to explain these increasingly irrational and seemingly arbitrary requests, “because you’re not allowed to bring bags with logos inside.” As you may have divined, I had many a terse confrontation over this policy.

Thankfully, the ban has finally been lifted and the team’s policy has been officially updated, bringing the Yanks into line with the several hundred other professional sporting facilities in the country. This isn’t to congratulate the Yankees on finally showing some common sense, but merely one last Bronx cheer for over eight years of idiocy and inconvenience.

Hat tip to Neil deMause, who also passed along potentially good news about Yankees playoff ticket prices. A rare week when the morons, imbeciles, crooks and thugs running the non-baseball side of the operation do more than one right.

The Mad MVP Scientist

This past week, I toiled in my laboratory attempting to build an MVP predictor (ESPN Insider part 1 / part 2) based upon past results, one that might lend some insight into who would win this year.

As the recent scrum between supporters of the candidacies of Joe Mauer and Mark Teixeira reminds us, nearly every Most Valuable Player award is capable of producing controversy. Not only do the Baseball Writers Association of America voters rarely elect the player who’s worth the most wins to his team via some objective formula, they appear to shift the standards from year to year, instead constructing narratives to fit whatever loosely-gathered facts are at hand. Particularly in recent years, defensive value is often minimized or entirely ignored in favor of heavy hitters with big Triple Crown stats, almost invariably from successful teams.

The question is whether the voters’ behavior can be predicted. Towards that end, I was tasked with building an MVP predictor in the spirit of a system such as Bill James’ Hall of Fame Monitor, one that awards points for various levels of achievement in an attempt to identify who will win, as opposed to who should win. My initial bursts of enthusiasm for the assignment were soon followed by endless hours of cowering in the fetal position before a massive spreadsheet, but in the end I emerged with a system — Jaffe’s Ugly MVP Predictor (JUMP) — which correctly identified 14 of the 28 winners during the Wild Card era (1995 onward), and put 27 of those winners among the league’s top three in its point totals.

I limited the scope of the system to that post-strike timeframe for three main reasons: none of the 28 winners were pitchers, only one (Alex Rodriguez in 2003) played for a team that finished below .500, and 22 of them played on teams that qualified for the expanded postseason — extremely strong tendencies that could help separate seemingly equal candidates. Instead of focusing on round-numbered benchmarks like James did (a .300 batting average, 100 RBI), I chose to dispense with actual stat totals and rates and focus on league rankings among batting title qualifiers (3.1 plate appearances per game) in 12 key offensive categories…

So anyway, I built a point system which rewarded top 10 placement in 12 categories (a few of which — OBP and hits, among others — turned out to be insignificant in predicting voter behavior), added a very strong team success component which could be worth more than two or three category leads, and then gerrymandered the hell out of the thing to increase the number of successful hits and top threes, the latter a concession to the fact that at some point subjective elements take over for a number of voters. My maneuvers included adding positional bonuses for middle infielders and a penalty for being primarily a DH, a penalty for playing for the Rockies, fractional weighting for a couple of categories — moves which through endless, tedious trial and error increased the system’s accuracy bit by bit.

Here’s how the actual award winners fared in JUMP, along with the players it flagged as the likely winners in years where they differed from the voting:

Year   AL Winner          Rank    System Winner
1995 Mo Vaughn 3 Albert Belle
1996 Juan Gonzalez 2 Albert Belle
1997 Ken Griffey 1
1998 Juan Gonzalez 1
1999 Ivan Rodriguez 10 Manny Ramirez
2000 Jason Giambi 1
2001 Ichiro Suzuki 2 Bret Boone
2002 Miguel Tejada 2 Alfonso Soriano
2003 Alex Rodriguez 1
2004 Vladimir Guerrero 1
2005 Alex Rodriguez 1
2006 Justin Morneau 3 Derek Jeter
2007 Alex Rodriguez 1
2008 Dustin Pedroia 1

Year NL Winner Rank System Winner

1995 Barry Larkin 3 Dante Bichette
1996 Ken Caminiti 1
1997 Larry Walker 2 Jeff Bagwell
1998 Sammy Sosa 1
1999 Chipper Jones 1
2000 Jeff Kent 3 Barry Bonds
2001 Barry Bonds 3 Sammy Sosa
2002 Barry Bonds 1
2003 Barry Bonds 1
2004 Barry Bonds 3 Albert Pujols
2005 Albert Pujols 1
2006 Ryan Howard 2 Albert Pujols
2007 Jimmy Rollins 3 Matt Holliday
2008 Albert Pujols 2 Ryan Howard

Ivan Rodriguez’s 1999 victory — which still chafes my ass a decade on, because Derek Jeter had a monster year (349/.438/.552 with 24 homers, 134 runs and 102 RBI, all career highs) – is the system’s big outlier, not to mention the only catcher who won during this era. That bodes poorly for Mauer, who as it is doesn’t rank in the top 10 in any counting stat category and plays for a team unlikely to make the playoffs; he ranked just 28th when I ran the numbers on Sunday, and with his team’s win to get right back to .500, that only pushes him to 15th. Mind you, this isn’t a prediction that Mauer would finish 15th in the voting, or that he deserves to; as Mae West famously said, “Goodness has nothing to do with it.” Basically what JUMP is saying is that history tells us that unless Mauer scores in the league’s top three, he’s got no chance of actually winning the award. Meanwhile, “Golden Boy” Teixeira leads the AL rankings thanks to running first in RBI, second in homers, and sixth in slugging while playing for a playoff bound team.

In all, it was a fun and satisfying project. I’ve got a few ideas that might increase its accuracy a hair, and I’ll revisit the topic if they turn out to be worthwhile.

Back in the Sausage Factory

As is my custom, every summer I take BP reader inside the sausage factory that is the Hit List. Usually it’s done during the All-Star week, but for some reason I waited with this year’s model:

It happens every week: a reader sees his favorite team trailing one of its division rivals in the Hit List rankings despite leading in the actual division race and fires off a snarky email or comment questioning the validity of the list, often while attempting to divine the current location of my head, and usually while making reference to last year’s division race or postseason results. Well into my fifth season of writing the Hit List, I’m far more amused by such occurrences than I am offended, but the weekly give and take serves as a reminder for the occasional need to explain the list’s workings in greater detail. As such, I annually set aside a column called the Hit List Remix to walk readers through the process.

First, a quick refresher course on the Hit List’s basics. It’s BP’s version of the power rankings, created by me back in 2005 and based upon an objective formula which averages a team’s actual, first-, second- and third-order winning percentages via the Adjusted Standings. To go into a bit more detail:

• First-order winning percentage is computed (via Pythagenpat, Pythagoras’ slightly more sophisticated sibling) using actual runs scored and allowed.

• Second-order winning percentage uses equivalent runs scored and allowed, based on run elements (hits, walks, total bases, stolen bases, etc.) and the scoring environment (park and league adjustments).

• Third-order winning percentage adjusts for the quality of the opponent’s hitting and pitching via opposing hitter EqA (OppHEqA) and opposing pitcher EqA (OppPEqA), both of which Clay Davenport recently added to the Adjusted Standings report for those of you curious enough to care.

With the exception of an injection of preseason PECOTA projections during the season’s first month, those numbers are all that go into the rankings, which are averaged into what I’ve called the Hit List Factor (HLF). There are no subjective choices to be made, no additional tweaking to favor the A’s or hurt the Phillies or fit into any of the other 28 conspiracy theories our readers might think of offering. No recent hot or cold streaks or head-to-head records are accounted for, either, despite the frustration of readers wondering why their team hasn’t vaulted to the top thanks to a 5-2 week against their division rivals. It’s all about runs, actual ones and projected ones, because run scoring and run prevention give us the best indication of a team’s strength going forward. Using all four percentages is a way for correcting for teams that over- or underperform relative to the various areas examined.

After running through the basics, I took a look at the relative strength of each division and dug deeper into the nuts and bolts of a few races where a team’s ranking outdid their division standing such as the Rays being ahead of the Red Sox on the Hit List but behind them in the AL East. The article is free, so take a look.

The Hit List itself was a freebie as well. Once again, the Dodgers and Yankees were 1-2:

[#1 Dodgers] Knuckling Down: An extra-inning loss to the Rockies shaves the Dodgers’ division lead to two games, but they rebound to win the series behind a solid debut by Vicente Padilla, recently released by the Rangers. The Dodgers are getting good results from the pitchers they’ve pulled off the scrapheap; knuckleballer Charlie Haeger combines to shut out the Cubs earlier in the week. For all of their recent rotation woes, they’re second in the league in SNLVAR, and while the team is just 14-17 since July 25, they’ve outscored opponents by 18 runs in that span.

[#2 Yankees] Godzilla and Friends: Hideki Matsui’s pair of two-homer games help the Yankees stave off the Red Sox by taking two out of three in Fenway; he drives in seven amid a 20-run deluge in the opener. Matsui’s’ 23 homers rank second to Mark Teixeira’s 31, and with Robinson Cano contributing a pair of shots (and reaching a new career high), the team now has six players with at least 20 blasts, the third time in franchise history (1961, 2004) they’ve reached that plateau. Jorge Posada (17) and Derek Jeter (16) could help them surpass the 1996 Orioles, 2000 Blue Jays and 2005 Rangers, who had seven reach that mark.

[#22 Mets] Escape From New York: Just two innings into his comeback from Tommy John surgery, Billy Wagner gets traded to the Red Sox for a pair of PTBNLs, making him lucky enough to avoid the soaring body count, not to mention Omar Minaya’s continued reign of error. The Mets lose both Johan Santana and Oliver Perez to season-ending surgery, the former due to bone chips in his elbow which have contributed to a 4.02 ERA and a 5.4 K/9 over his last 15 starts, the latter to patellar tendon tendinosis which turned his season into a 6.82 ERA, 7.9 BB/9 nightmare. Jeff Francouer could join the party as well due to a torn thumb ligament; his .305/.331/.500 line since being acquired includes just three unintentional walks in 175 PA.

Tough to believe the nightmare that is this year’s Mets. Can’t recall a more pungent combination of insult and injury.

Give Me Strength… of Schedule

Lots of links to catch up with, as it was a four-article week for me at Baseball Prospectus, so I’ll break it into two posts. First up, I revisited the strength of schedule methodology I used a couple times earlier this year for a two-part look at the contenders’ remaining schedules, using the Hit List Factor — the average of each team’s actual record and various Pythagorean-based records from our Adjusted Standings report — which I call upon every week for the BP power rankings (more on that next post).

For each team, I computed opponents’ strength of schedule, both for the games played through August 24 and for the balance of the schedule beyond that:

Instead of plugging in the Hit List Factor uniformly, we’ve again applied historically-derived adjustments to account for the home team winning 55 percent of the time, and for the AL winning 58 percent of interleague games. Using the log5 method, this boils down to a 25-point (.025) bonus or tax applied based on whether the opponent is at home or on the road, and a 40-point (.040) one applied for interleague play. To apply some revisionist history to our Big Apple example—indeed, ongoing strength-of-schedule calculations are the definition of revisionist history—when the Yankees (.604) played the Mets (.460) at Yankee Stadium, the latter’s adjusted winning percentage was recorded as .460 – .025 – .040 = .395. When they play at Citi Field, it was recorded as .460 + .025 – .040 = .445. From the Mets’ point of view, the Yankees were a .669 team (.604 + .025 + .040) in the Bronx and a .619 (.604 – .025 + .040) team in Queens.

Both leagues have eight teams apiece with nominal chances at reaching the postseason. Here’s how the AL contenders stack up (BP/ESPN Insider), along with their chances of reaching the postseason from our Playoff Odds report (through Wednesday):

            Leftover Previous  Overall   Playoff
Team Schedule Schedule Schedule Odds
Orioles .542 .516 .521
Blue Jays .532 .508 .513
Royals .521 .497 .503
White Sox .517 .484 .491 13.6%
Rays .517 .498 .502 24.6%
Athletics .510 .517 .515
Rangers .509 .496 .499 34.7%
Mariners .507 .503 .504
Yankees .503 .501 .502 98.7%
Angels .501 .503 .502 79.5%
Red Sox .501 .507 .506 59.2%
Tigers .496 .491 .492 64.1%
Indians .485 .498 .495
Twins .480 .495 .492 22.1%

In the AL, the next five weeks feature the contenders playing each other about half the time; the White Sox play 23 of their remaining 35 games against other contenders, including the one they played against the Yankees tonight. For the Yanks, it’s 18 out of 35, including nine of their final 12. The Twins, who have the easiest schedule remaining, play just 16 out of their final 35 against contenders — but they’ve also got Carl Pavano. Push.

Turning to the NL (BP/ESPN):

            Leftover Previous  Overall   Playoff
Team Schedule Schedule Schedule Odds
Nationals .525 .504 .509
Padres .520 .514 .515
D'backs .515 .503 .506
Mets .508 .509 .509
Brewers .506 .489 .493
Giants .505 .501 .502 12.2%
Astros .499 .493 .494
Reds .496 .493 .493
Pirates .491 .494 .493
Marlins .485 .508 .503 8.8%
Rockies .483 .502 .497 75.7%
Braves .479 .502 .497 9.0%
Phillies .477 .500 .495 93.6%
Cardinals .471 .481 .479 97.3%
Dodgers .467 .505 .496 98.7%
Cubs .460 .494 .487 4.5%

Despite having eight contenders, the Senior Circuit has a lot more stratification, with three teams nearly locks for the playoffs and the Rockies heavily favored for the Wild Card (though as I write this, the Giants’ Tim Lincecum is shutting out Colorado while the Rockies’ Ubaldo Jimenez yielded a solo homer to Pablo Sandoval). Not only that, but most of the contenders will only play about a third of their remaining games against each other. From that group, the Giants have the toughest schedule by 20 points, and they play 18 out of 34 against contenders, while the Dodgers play just nine.

In all, it definitely looks as though the NL will see a lot of September scoreboard watching interspersed with a handful of meaningful series, while the AL will see a lot more head-to-head action with playoff implications.